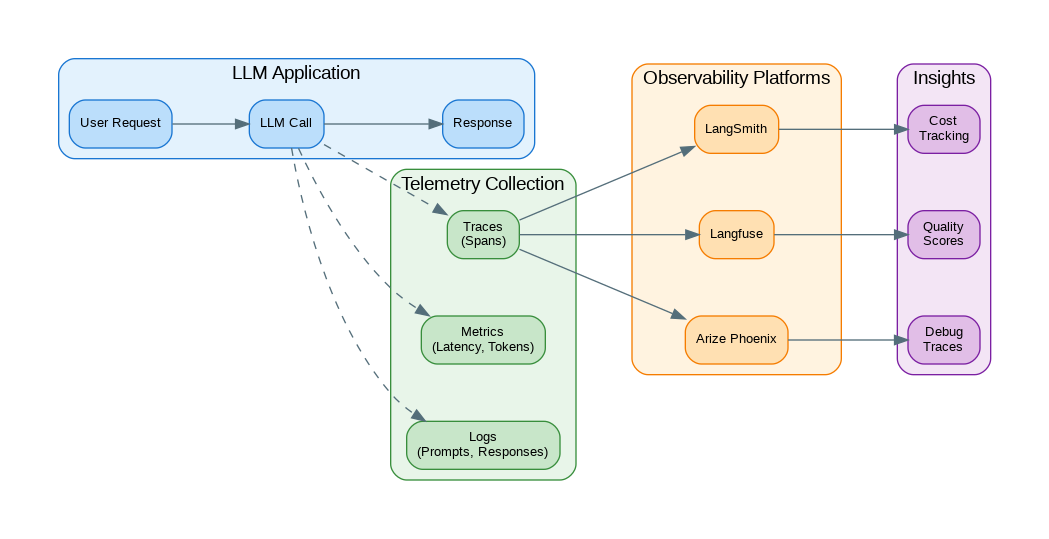
Introduction: You can’t improve what you can’t measure. LLM applications are notoriously difficult to debug—prompts are opaque, responses are non-deterministic, and failures often manifest as subtle quality degradation rather than crashes. Observability gives you visibility into every LLM call: what prompts were sent, what responses came back, how long it took, how much it cost, and whether users were satisfied. This guide covers implementing comprehensive LLM observability using tools like LangSmith, Langfuse, and custom instrumentation, with patterns for tracing, cost tracking, and quality monitoring.
- Part 1: Tracing, metrics, and logging fundamentals
- Part 2 (this article): Cost tracking and quality monitoring
Quality Monitoring Pipeline
Quality monitoring goes beyond basic metrics to evaluate LLM output quality. This pipeline shows how to track and alert on quality degradation.
flowchart TB
    subgraph Collection["Data Collection"]
        REQ[Request Log]
        RES[Response Log]
        FB[User Feedback]
    end

    subgraph Evaluation["Quality Evaluation"]
        RL[Relevance Score]
        FL[Fluency Check]
        FC[Factuality Check]
    end

    subgraph Aggregation["Aggregation"]
        QS[Quality Score]
        TR[Trend Analysis]
    end

    subgraph Action["Actions"]
        AL[Alerts]
        DB[Dashboard]
        RP[Reports]
    end

    REQ --> RL
    RES --> RL
    RES --> FL
    RES --> FC
    FB --> QS
    RL --> QS
    FL --> QS
    FC --> QS
    QS --> TR
    TR --> AL
    TR --> DB
    TR --> RP

    style REQ fill:#E3F2FD,stroke:#90CAF9,stroke-width:2px,color:#1565C0
    style RES fill:#E3F2FD,stroke:#90CAF9,stroke-width:2px,color:#1565C0
    style FB fill:#E3F2FD,stroke:#90CAF9,stroke-width:2px,color:#1565C0
    style RL fill:#F3E5F5,stroke:#CE93D8,stroke-width:2px,color:#6A1B9A
    style FL fill:#F3E5F5,stroke:#CE93D8,stroke-width:2px,color:#6A1B9A
    style FC fill:#F3E5F5,stroke:#CE93D8,stroke-width:2px,color:#6A1B9A
    style QS fill:#E8F5E9,stroke:#A5D6A7,stroke-width:2px,color:#2E7D32
    style TR fill:#E8F5E9,stroke:#A5D6A7,stroke-width:2px,color:#2E7D32
    style AL fill:#FFF3E0,stroke:#FFCC80,stroke-width:2px,color:#E65100
    style DB fill:#FFF3E0,stroke:#FFCC80,stroke-width:2px,color:#E65100
    style RP fill:#FFF3E0,stroke:#FFCC80,stroke-width:2px,color:#E65100
Figure 1: Quality Monitoring Pipeline
Basic Instrumentation
The following code implements basic instrumentation. Key aspects include proper error handling and clean separation of concerns.
import time
import uuid
from dataclasses import dataclass, field
from datetime import datetime
from typing import Optional, Any
import json

@dataclass
class LLMSpan:
    """A single LLM operation span."""
    span_id: str
    trace_id: str
    name: str
    start_time: datetime
    end_time: Optional[datetime] = None
    model: str = ""
    prompt: str = ""
    response: str = ""
    tokens_input: int = 0
    tokens_output: int = 0
    latency_ms: float = 0
    cost_usd: float = 0
    metadata: dict = field(default_factory=dict)
    error: Optional[str] = None

class LLMTracer:
    """Simple LLM tracing implementation."""

    # Cost per 1K tokens (approximate)
    COSTS = {
        "gpt-4-turbo-preview": {"input": 0.01, "output": 0.03},
        "gpt-4o": {"input": 0.005, "output": 0.015},
        "gpt-4o-mini": {"input": 0.00015, "output": 0.0006},
        "claude-3-5-sonnet": {"input": 0.003, "output": 0.015},
    }

    def __init__(self):
        self.spans: list[LLMSpan] = []
        self.current_trace_id: Optional[str] = None

    def start_trace(self, name: str = "default") -> str:
        """Start a new trace."""
        self.current_trace_id = str(uuid.uuid4())
        return self.current_trace_id

    def start_span(self, name: str, model: str = "", prompt: str = "") -> LLMSpan:
        """Start a new span within current trace."""
        span = LLMSpan(
            span_id=str(uuid.uuid4()),
            trace_id=self.current_trace_id or str(uuid.uuid4()),
            name=name,
            start_time=datetime.now(),
            model=model,
            prompt=prompt
        )
        return span

    def end_span(
        self,
        span: LLMSpan,
        response: str,
        tokens_input: int,
        tokens_output: int,
        error: Optional[str] = None
    ):
        """End a span and calculate metrics."""
        span.end_time = datetime.now()
        span.response = response
        span.tokens_input = tokens_input
        span.tokens_output = tokens_output
        span.error = error

        # Calculate latency
        span.latency_ms = (span.end_time - span.start_time).total_seconds() * 1000

        # Calculate cost
        if span.model in self.COSTS:
            costs = self.COSTS[span.model]
            span.cost_usd = (
                (tokens_input / 1000) * costs["input"] +
                (tokens_output / 1000) * costs["output"]
            )

        self.spans.append(span)
        return span

    def get_trace_summary(self, trace_id: str) -> dict:
        """Get summary for a trace."""
        trace_spans = [s for s in self.spans if s.trace_id == trace_id]

        return {
            "trace_id": trace_id,
            "span_count": len(trace_spans),
            "total_latency_ms": sum(s.latency_ms for s in trace_spans),
            "total_tokens": sum(s.tokens_input + s.tokens_output for s in trace_spans),
            "total_cost_usd": sum(s.cost_usd for s in trace_spans),
            "errors": [s.error for s in trace_spans if s.error]
        }

# Decorator for automatic tracing
def trace_llm_call(tracer: LLMTracer):
    """Decorator to automatically trace LLM calls."""
    def decorator(func):
        def wrapper(*args, **kwargs):
            span = tracer.start_span(
                name=func.__name__,
                model=kwargs.get("model", "unknown"),
                prompt=str(kwargs.get("messages", kwargs.get("prompt", "")))[:1000]
            )

            try:
                result = func(*args, **kwargs)

                # Extract response info
                if hasattr(result, "choices"):
                    response = result.choices[0].message.content
                    tokens_in = result.usage.prompt_tokens
                    tokens_out = result.usage.completion_tokens
                else:
                    response = str(result)
                    tokens_in = tokens_out = 0

                tracer.end_span(span, response, tokens_in, tokens_out)
                return result

            except Exception as e:
                tracer.end_span(span, "", 0, 0, error=str(e))
                raise

        return wrapper
    return decorator

# Usage
tracer = LLMTracer()

@trace_llm_call(tracer)
def call_openai(**kwargs):
    from openai import OpenAI
    client = OpenAI()
    return client.chat.completions.create(**kwargs)

# Make traced call
tracer.start_trace("user_query")
response = call_openai(
    model="gpt-4-turbo-preview",
    messages=[{"role": "user", "content": "Hello!"}]
)
print(tracer.get_trace_summary(tracer.current_trace_id))
LangSmith Integration
The following code implements langsmith integration. Key aspects include proper error handling and clean separation of concerns.
# pip install langsmith

import os
from langsmith import Client
from langsmith.wrappers import wrap_openai
from openai import OpenAI

# Set environment variables
os.environ["LANGCHAIN_TRACING_V2"] = "true"
os.environ["LANGCHAIN_API_KEY"] = "your-langsmith-api-key"
os.environ["LANGCHAIN_PROJECT"] = "my-llm-app"

# Wrap OpenAI client for automatic tracing
client = wrap_openai(OpenAI())

# All calls are now automatically traced
response = client.chat.completions.create(
    model="gpt-4-turbo-preview",
    messages=[{"role": "user", "content": "What is LangSmith?"}]
)

# Manual run logging
from langsmith import traceable

@traceable(name="process_query")
def process_query(query: str) -> str:
    """Process a user query with tracing."""

    # This will be traced as a child span
    response = client.chat.completions.create(
        model="gpt-4-turbo-preview",
        messages=[{"role": "user", "content": query}]
    )

    return response.choices[0].message.content

# Add feedback/evaluation
ls_client = Client()

# Log feedback on a run
ls_client.create_feedback(
    run_id="run-uuid-here",
    key="user_rating",
    score=1.0,  # 0-1 scale
    comment="Helpful response"
)

# Create dataset for evaluation
dataset = ls_client.create_dataset("qa-examples")

ls_client.create_example(
    inputs={"question": "What is Python?"},
    outputs={"answer": "Python is a programming language."},
    dataset_id=dataset.id
)

# Run evaluation
from langsmith.evaluation import evaluate

def my_app(inputs: dict) -> dict:
    response = process_query(inputs["question"])
    return {"answer": response}

results = evaluate(
    my_app,
    data="qa-examples",
    evaluators=["qa"],  # Built-in QA evaluator
)
Langfuse Integration
Langfuse provides specialized LLM observability with automatic prompt/response logging, cost tracking, and quality metrics. The following integration captures detailed traces of every LLM interaction.
# pip install langfuse

from langfuse import Langfuse
from langfuse.decorators import observe, langfuse_context
from langfuse.openai import openai

# Initialize Langfuse
langfuse = Langfuse(
    public_key="pk-...",
    secret_key="sk-...",
    host="https://cloud.langfuse.com"
)

# Automatic OpenAI tracing
from langfuse.openai import OpenAI

client = OpenAI()

response = client.chat.completions.create(
    model="gpt-4-turbo-preview",
    messages=[{"role": "user", "content": "Hello!"}],
    # Langfuse-specific parameters
    name="greeting",
    metadata={"user_id": "user123"},
    tags=["production"]
)

# Decorator-based tracing
@observe()
def process_document(doc: str) -> str:
    """Process document with full tracing."""

    # Add custom metadata
    langfuse_context.update_current_observation(
        metadata={"doc_length": len(doc)}
    )

    # Nested LLM call (automatically traced)
    summary = client.chat.completions.create(
        model="gpt-4-turbo-preview",
        messages=[
            {"role": "system", "content": "Summarize the document."},
            {"role": "user", "content": doc}
        ],
        name="summarize"
    )

    return summary.choices[0].message.content

# Manual span creation
@observe()
def complex_pipeline(query: str) -> str:
    """Pipeline with manual spans."""

    # Create child span for retrieval
    with langfuse_context.observe(name="retrieval") as span:
        docs = retrieve_documents(query)
        span.update(output={"doc_count": len(docs)})

    # Create child span for generation
    with langfuse_context.observe(name="generation") as span:
        response = generate_response(query, docs)
        span.update(output={"response_length": len(response)})

    return response

# Score traces
langfuse.score(
    trace_id="trace-id",
    name="user_feedback",
    value=1,
    comment="User marked as helpful"
)

# Flush before exit
langfuse.flush()
Cost Tracking and Budgets
The following code implements cost tracking and budgets. Key aspects include proper error handling and clean separation of concerns.
from dataclasses import dataclass
from datetime import datetime, timedelta
from collections import defaultdict
import threading

@dataclass
class CostBudget:
    daily_limit_usd: float
    monthly_limit_usd: float
    alert_threshold: float = 0.8  # Alert at 80%

class CostTracker:
    """Track and enforce LLM cost budgets."""

    COSTS_PER_1K = {
        "gpt-4-turbo-preview": {"input": 0.01, "output": 0.03},
        "gpt-4o": {"input": 0.005, "output": 0.015},
        "gpt-4o-mini": {"input": 0.00015, "output": 0.0006},
        "gpt-3.5-turbo": {"input": 0.0005, "output": 0.0015},
        "claude-3-5-sonnet-20241022": {"input": 0.003, "output": 0.015},
        "claude-3-haiku-20240307": {"input": 0.00025, "output": 0.00125},
    }

    def __init__(self, budget: CostBudget):
        self.budget = budget
        self.costs: dict[str, list[tuple[datetime, float]]] = defaultdict(list)
        self.lock = threading.Lock()

    def calculate_cost(self, model: str, input_tokens: int, output_tokens: int) -> float:
        """Calculate cost for a single call."""
        if model not in self.COSTS_PER_1K:
            return 0.0

        costs = self.COSTS_PER_1K[model]
        return (
            (input_tokens / 1000) * costs["input"] +
            (output_tokens / 1000) * costs["output"]
        )

    def record_cost(self, model: str, input_tokens: int, output_tokens: int, user_id: str = "default"):
        """Record a cost entry."""
        cost = self.calculate_cost(model, input_tokens, output_tokens)

        with self.lock:
            self.costs[user_id].append((datetime.now(), cost))

        # Check budgets
        self._check_budgets(user_id)

        return cost

    def get_daily_cost(self, user_id: str = "default") -> float:
        """Get total cost for today."""
        today = datetime.now().date()

        with self.lock:
            return sum(
                cost for ts, cost in self.costs[user_id]
                if ts.date() == today
            )

    def get_monthly_cost(self, user_id: str = "default") -> float:
        """Get total cost for this month."""
        now = datetime.now()
        month_start = now.replace(day=1, hour=0, minute=0, second=0)

        with self.lock:
            return sum(
                cost for ts, cost in self.costs[user_id]
                if ts >= month_start
            )

    def _check_budgets(self, user_id: str):
        """Check if budgets are exceeded."""
        daily = self.get_daily_cost(user_id)
        monthly = self.get_monthly_cost(user_id)

        if daily >= self.budget.daily_limit_usd:
            raise BudgetExceededError(f"Daily budget exceeded: ${daily:.2f}")

        if monthly >= self.budget.monthly_limit_usd:
            raise BudgetExceededError(f"Monthly budget exceeded: ${monthly:.2f}")

        # Alert at threshold
        if daily >= self.budget.daily_limit_usd * self.budget.alert_threshold:
            self._send_alert(f"Daily budget at {daily/self.budget.daily_limit_usd:.0%}")

    def _send_alert(self, message: str):
        """Send budget alert."""
        print(f"ALERT: {message}")  # Replace with actual alerting

    def get_report(self) -> dict:
        """Generate cost report."""
        report = {
            "daily_cost": self.get_daily_cost(),
            "monthly_cost": self.get_monthly_cost(),
            "daily_budget": self.budget.daily_limit_usd,
            "monthly_budget": self.budget.monthly_limit_usd,
            "daily_utilization": self.get_daily_cost() / self.budget.daily_limit_usd,
            "monthly_utilization": self.get_monthly_cost() / self.budget.monthly_limit_usd,
        }
        return report

class BudgetExceededError(Exception):
    pass

# Usage
budget = CostBudget(daily_limit_usd=10.0, monthly_limit_usd=200.0)
tracker = CostTracker(budget)

# Wrap LLM calls
def tracked_completion(client, **kwargs):
    response = client.chat.completions.create(**kwargs)

    tracker.record_cost(
        model=kwargs["model"],
        input_tokens=response.usage.prompt_tokens,
        output_tokens=response.usage.completion_tokens
    )

    return response
Quality Monitoring
Monitoring provides visibility into system behavior. The following code instruments key metrics for observability.
from dataclasses import dataclass
from typing import Callable
import statistics

@dataclass
class QualityMetrics:
    response_length: int
    latency_ms: float
    has_error: bool
    user_rating: Optional[float] = None
    relevance_score: Optional[float] = None

class QualityMonitor:
    """Monitor LLM response quality over time."""

    def __init__(self, window_size: int = 100):
        self.window_size = window_size
        self.metrics: list[QualityMetrics] = []
        self.alerts: list[Callable] = []

    def record(self, metrics: QualityMetrics):
        """Record quality metrics."""
        self.metrics.append(metrics)

        # Keep window size
        if len(self.metrics) > self.window_size * 2:
            self.metrics = self.metrics[-self.window_size:]

        # Check for anomalies
        self._check_anomalies()

    def _check_anomalies(self):
        """Check for quality anomalies."""
        if len(self.metrics) < 10:
            return

        recent = self.metrics[-10:]

        # Error rate spike
        error_rate = sum(1 for m in recent if m.has_error) / len(recent)
        if error_rate > 0.2:
            self._alert(f"High error rate: {error_rate:.0%}")

        # Latency spike
        recent_latency = [m.latency_ms for m in recent]
        historical_latency = [m.latency_ms for m in self.metrics[:-10]]

        if historical_latency:
            avg_historical = statistics.mean(historical_latency)
            avg_recent = statistics.mean(recent_latency)

            if avg_recent > avg_historical * 2:
                self._alert(f"Latency spike: {avg_recent:.0f}ms vs {avg_historical:.0f}ms")

        # Quality drop
        recent_ratings = [m.user_rating for m in recent if m.user_rating is not None]
        if len(recent_ratings) >= 5:
            avg_rating = statistics.mean(recent_ratings)
            if avg_rating < 0.6:
                self._alert(f"Low user ratings: {avg_rating:.2f}")

    def _alert(self, message: str):
        """Trigger alert."""
        for callback in self.alerts:
            callback(message)

    def get_dashboard_data(self) -> dict:
        """Get data for monitoring dashboard."""
        if not self.metrics:
            return {}

        recent = self.metrics[-self.window_size:]

        return {
            "total_requests": len(self.metrics),
            "error_rate": sum(1 for m in recent if m.has_error) / len(recent),
            "avg_latency_ms": statistics.mean(m.latency_ms for m in recent),
            "p95_latency_ms": statistics.quantiles([m.latency_ms for m in recent], n=20)[18],
            "avg_response_length": statistics.mean(m.response_length for m in recent),
            "avg_user_rating": statistics.mean(
                m.user_rating for m in recent if m.user_rating is not None
            ) if any(m.user_rating for m in recent) else None,
        }

# Prometheus metrics export
from prometheus_client import Counter, Histogram, Gauge

llm_requests_total = Counter(
    'llm_requests_total',
    'Total LLM requests',
    ['model', 'status']
)

llm_latency_seconds = Histogram(
    'llm_latency_seconds',
    'LLM request latency',
    ['model'],
    buckets=[0.1, 0.5, 1, 2, 5, 10, 30]
)

llm_tokens_total = Counter(
    'llm_tokens_total',
    'Total tokens used',
    ['model', 'type']
)

llm_cost_usd = Counter(
    'llm_cost_usd_total',
    'Total cost in USD',
    ['model']
)

def record_prometheus_metrics(model: str, latency: float, tokens_in: int, tokens_out: int, cost: float, error: bool = False):
    """Record metrics to Prometheus."""
    status = "error" if error else "success"

    llm_requests_total.labels(model=model, status=status).inc()
    llm_latency_seconds.labels(model=model).observe(latency)
    llm_tokens_total.labels(model=model, type="input").inc(tokens_in)
    llm_tokens_total.labels(model=model, type="output").inc(tokens_out)
    llm_cost_usd.labels(model=model).inc(cost)
References
- LangSmith: https://docs.smith.langchain.com/
- Langfuse: https://langfuse.com/docs
- Arize Phoenix: https://docs.arize.com/phoenix
- OpenTelemetry: https://opentelemetry.io/
- Prometheus: https://prometheus.io/docs/
Conclusion
LLM observability is the foundation for building reliable AI applications. Without visibility into what your models are doing, you’re flying blind—unable to debug issues, optimize costs, or improve quality. Start with basic instrumentation that captures prompts, responses, latency, and tokens for every call. Add cost tracking early to avoid surprise bills. Use platforms like LangSmith or Langfuse for rich tracing and evaluation capabilities. Implement quality monitoring to catch degradation before users complain. The investment in observability pays dividends throughout the application lifecycle—from development debugging to production incident response to continuous improvement. Remember that LLM behavior can drift over time as providers update models, so ongoing monitoring is essential even for stable applications.
Key Takeaways
- ✅ Trace every request – Full observability into LLM call chains
- ✅ Track costs per feature – Know where budget goes
- ✅ Monitor quality metrics – Catch degradation before users complain
- ✅ Log prompts and responses – Essential for debugging and improvement
- ✅ Set up alerts – Proactive notification of anomalies
Conclusion
Effective observability transforms LLM development from guesswork to data-driven iteration. With comprehensive tracing, metrics, and quality monitoring, you can optimize costs, improve quality, and debug issues rapidly.
References
Discover more from C4: Container, Code, Cloud & Context
Subscribe to get the latest posts sent to your email.